Understanding Support Levels For Digital Turbine Inc (APPS) Using TA
For those who have read my writings, I am a FA investor with a focus on the company's business model, competitors, competitive advantage, management, and financials.
Digital Turbine Inc. (Ticker: APPS) is a company that I have the highest conviction in.
I have a friend who invests using Technical Analysis. Thus, I asked for his assistance in tracking APPS so that I could figure out what entry points I should pay attention to.
After all, APPS is on a downtrend and I want to know the significant support levels which I should average in, especially for someone who do not have any technical analysis knowledge.
Thus, he sent me the following on 1st March 22 and explained he will be using Fibonacci and Elliot Wave to determine the potential entry prices:
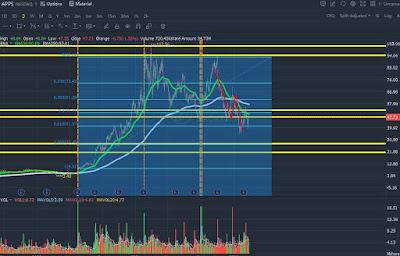 |
| Technical Analysis For Digital Turbine Inc (APPS) as of 1/3/22 |
Comments
Post a Comment